Well test interpretation to re-evaluate the field potential
Re-interpreting old well tests can help to re-evaluate the well and field potential or prepare for an EOR process (Enhanced Oil Recovery). By applying new techniques and tools (including Deconvolution), previous analysis could be re-visited to obtain a better understanding of the data and better describe the well and reservoir. But it is also an opportunity to extract some new “lessons learnt”, share learning within the company and improve the well testing process.
Below are some common remarks and recommendations when re-analyzing old well tests:
Completion and pressure gauges
Missing downhole shut-in tool
A downhole shut-in valve is recommended not only to minimize wellbore storage, but also to minimize wellbore phase redistribution, reduce vibrations from surface facilities, even reduce the risk of sand production for high permeability reservoirs, etc… It will guarantee the best quality well test data.
Not enough gauges in the tubing
More pressure gauges should be placed in various gauge carriers at specific distances in the tubing. Multiple gauges need to be placed strategically in the wellbore to monitor the fluid density over time and quality check the data. It is also good for redundancy, imagine if all your gauges failed for example due to temperature…
Incorrect positions of the pressure gauges
The location of the gauges are critical and could be a major risk: the entire well test could be misleading and not representative of the reservoir performance. The deepest gauges need to be placed as close as possible to the perforations and real-time gauges like Metrol could be clamped on the OD of the tubing.
Sampling rate not adapted for pressure transient analysis (PTA)
Sometimes the gauge sampling rate is not properly set up. This will have an impact on the interpretation plots. This also applies for production wells, with other problems like the compression algorithm.
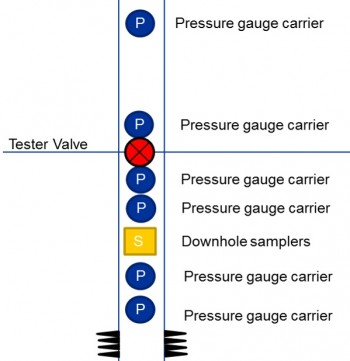
DST Equipments for E&A Well Testing
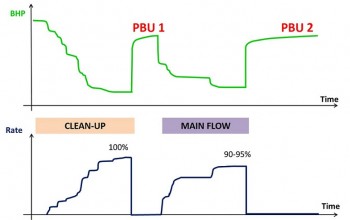
Well test design: 2 PBUs, one after clean-up and another one after main flow
Opportunity to save time
The short 1-2 hour PBU following a very short initial flow could be removed; experience showed that it doesn’t lead to representative data. Also, complex deliverability tests are not recommended in exploration and appraisal stage. A simple flow-after-flow test could be performed at the start of the main flow, once the well is cleaned.
2 PBUs please!
The well test sequence should have 2 important PBU tests, one after clean-up and another one after main flow.
A well test design study will help to make sure the 2 PBU tests are long enough to achieve the subsurface objectives and use the deconvolution technology.
The two PBUs can also help you detect any condensate drop out (or gas breakout) and understand its impact on productivity.
Operations
Stay in control during the well clean-up
During clean-up, start the well at very low choke size, then gradually and slowly increase the choke, taking 30 min to 1 hour per choke size, if needed. Make sure you understand the well behaviour and stay in control.
Optimize the test with access to real-time pressure data
Access to real-time data during the operations will help to take real-time decisions and optimize the test (reduce flaring and shorten the test operations while achieving the objectives with the best quality data). It will also improve safety.
Well test interpretation
Quality check the data
-
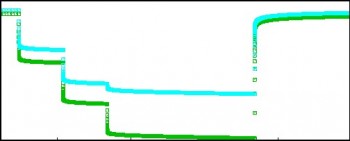
The data should be quality checked: the different gauges should be compared and all the PBU data should be shown on the same derivative plot.
-
It is not recommended to use the pseudo-time for the derivative. This could add some additional features in the derivative that can be mistakenly taken as flow regimes.
Find more than 1 solution that can match all the data
-
Use more than one reservoir model. Well test analysis is a non-unique process so various reservoir configurations should be investigated.
-
The radial composite model shouldn’t be used to characterize the reservoir in exploration and appraisal (unless acidification or multiphase in the reservoir). The radial composite model defines two circular regions around the well of different mobility (KH/μ) and/or storativity (ϕCt H) values. As a result, it does not well represent a geological feature.
-
Efforts should be made to have a good quality match of the conventional and deconvolved derivative data. Other plots, such as the superposition plot and the production history plot should also be matched. Several reservoir configurations should be investigated and well matched using all the plots. Then the solutions should be integrated with other sources of subsurface information (seismic, geology, etc…)
-
A wrong selection of the radial flow stabilization will result in uncertainty in the initial pressure, skin and permeability values.
Extract more value
-
The minimum connected volume, i.e. how much hydrocarbon the test has proven, should be included in the well test results.
-
Deconvolution should be the driving tool in well test interpretation. Deconvolution helps to refine initial pressure, provide a better understanding of the test and investigate further away in the reservoir. It could provide evidence for larger connected volume.

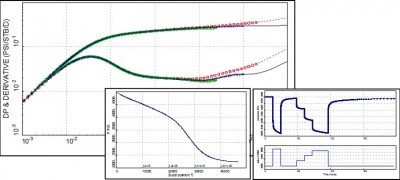

I am analyzing one of the PBU on a well in carbonate retrograde condensate reservoir. I am observing a very unique extremly short stabalization IARD (assumed) followed by an increase in kh ( sort of dual poro behaviour) immeidately followed by a bilinear slop followed by extensive 0.75 slope. (of about more than 1 log cycle). I have matched analytical with linear composite. Structurally it is likely a channel or U-shaped behaviour though we dont see 0.4-0.5 slope. Any had observed something like this and struturally related it to something ? Suggestions please. Any had any key points or tricks on numerical modeling of such tests ?
Thanks
Hi ChristnaGolaco,
The short derivative stabilization could also be a change in effective permeability to gas, for example if the well is producing below dew point.
We would also use the linear composite behaviour, assuming some heterogeneities in the reservoir.
Best Regards,
The TestWells team
Is it important to know if a DHSIT has been used for shut in ? Why is this important for the analysis?
Thanks 🙂
Hi Christina,
Thanks for your post. It is important to know if a DHSIT has been used, mainly for wellbore storage and phase redistribution. For example you may expect to see a larger wellbore storage or you could suspect wellbore phase redistribution (which could impact the derivative and create some artifacts) with a surface shut-in. For an injector, you may expect other differences between a surface and downhole shut in.
Sometimes a well is closed at surface for the first PBU then down hole for the second PBU during a DST (this is a practice that we do not recommend). The fluid density below the gauge may not be the same between the PBUs. As a result, Deconvolution or an analytical simulation may not work.
All the best,
The TestWells team